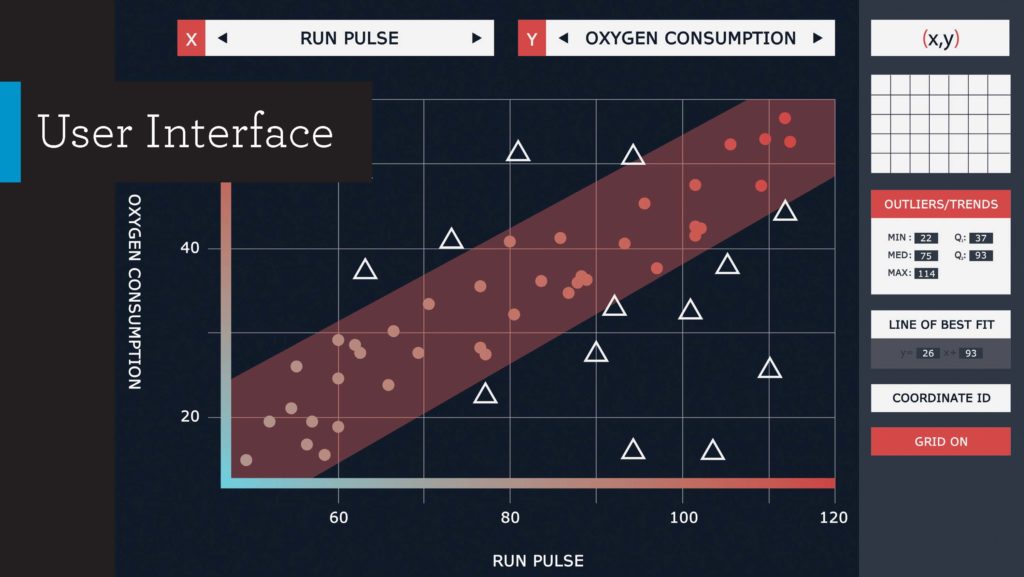
How might designers create data visualizations for low-vision users?

Undergraduate graphic design students at NC State University collaborated with SAS Analytics to answer this question as they explored how SAS products might be made accessible to a range of low vision users. The SAS team, led by engineer and accessibility lead Ed Summers, collaborate with students in my class over a 9-week period. The design process included Accessibility Training by the SAS team, a day-long symposium detailing a range of eye conditions at Duke Eye Center, and user-testing with BVI users.

Scenario Videos of Student Work

Student Designers: Tara Sullivan, Sam Linville, Lucia Boehling, Willow Lafone, Maria Cianchette

Student Designers: Claire Allison, Matt Babb, Phil Harrison, Jessye Holmgren-Sidell, Christina Opel, Rachel Radulovich

The Research Process

Project launch at SAS headquarters. Students and SAS team discussing project
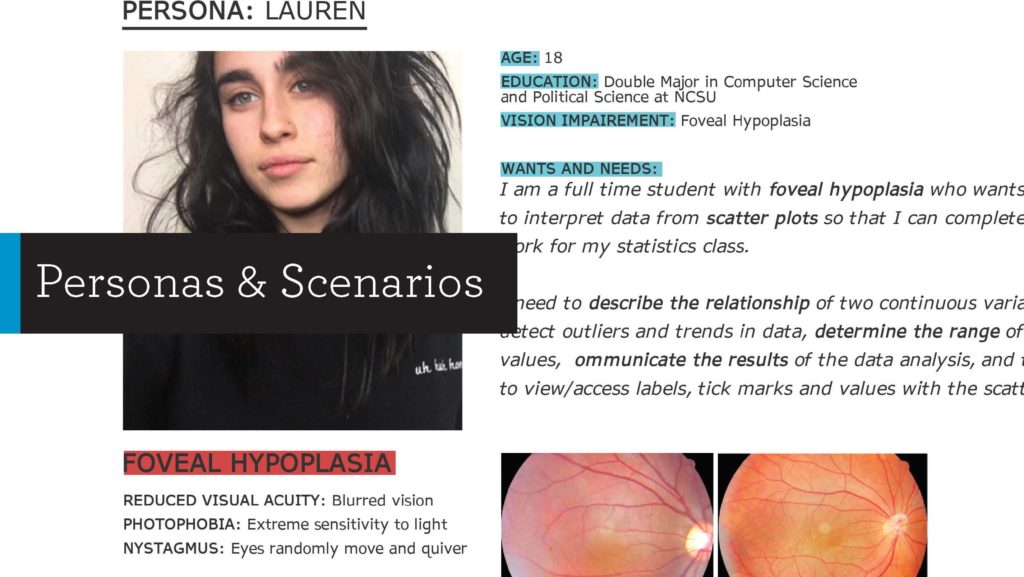
Created personas and scenarios
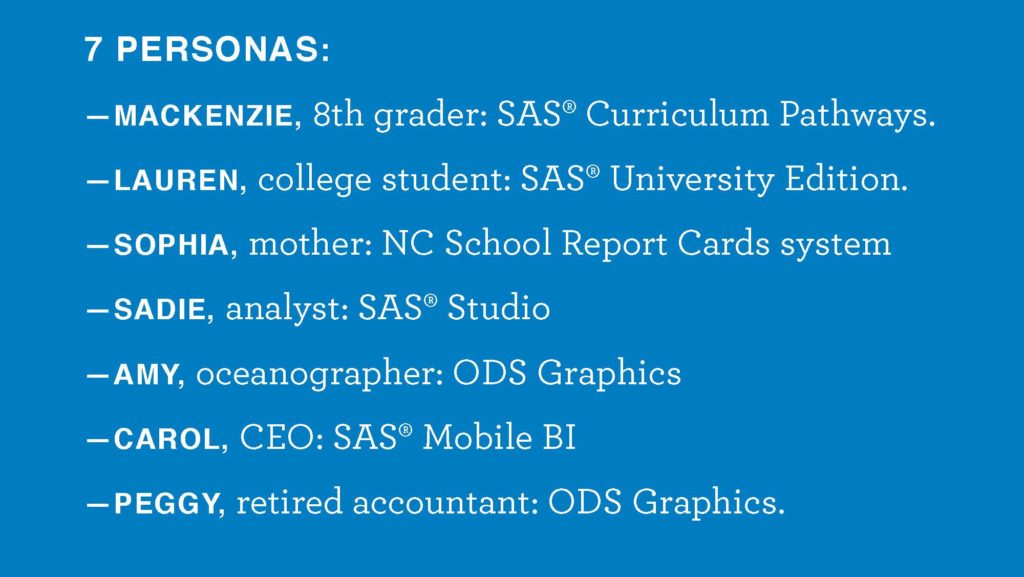
create 7 personas, each with a different visual impairment
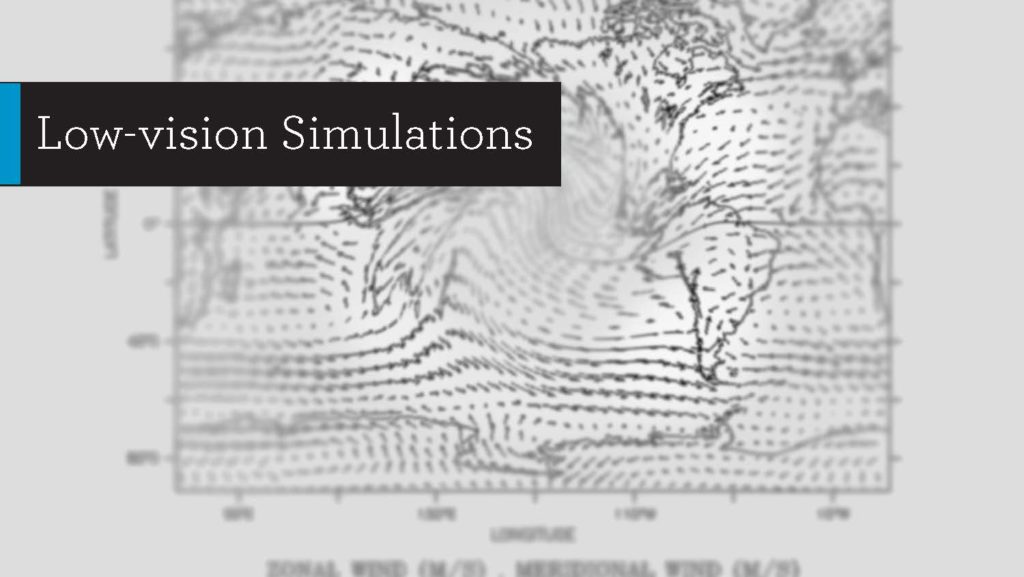
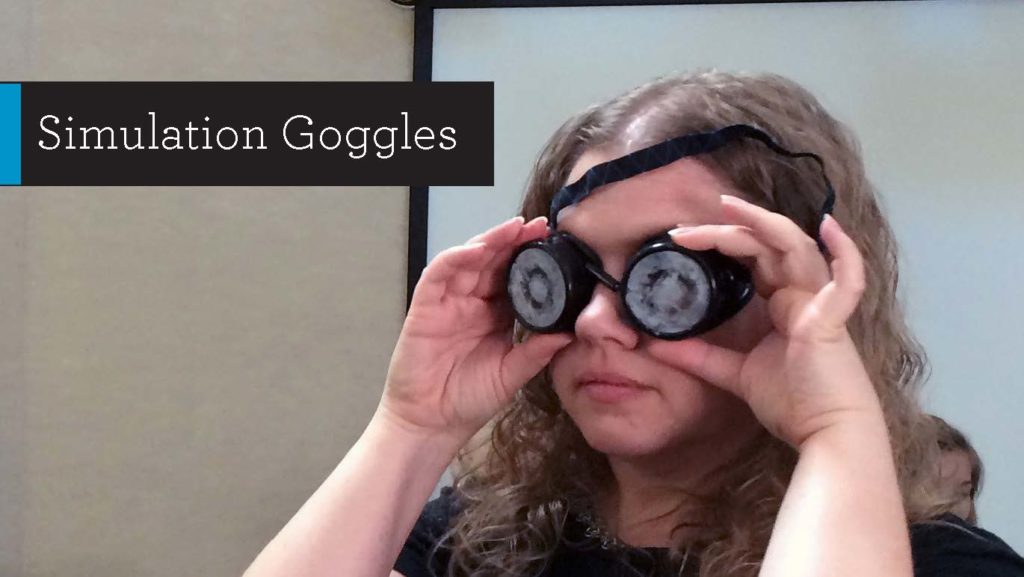
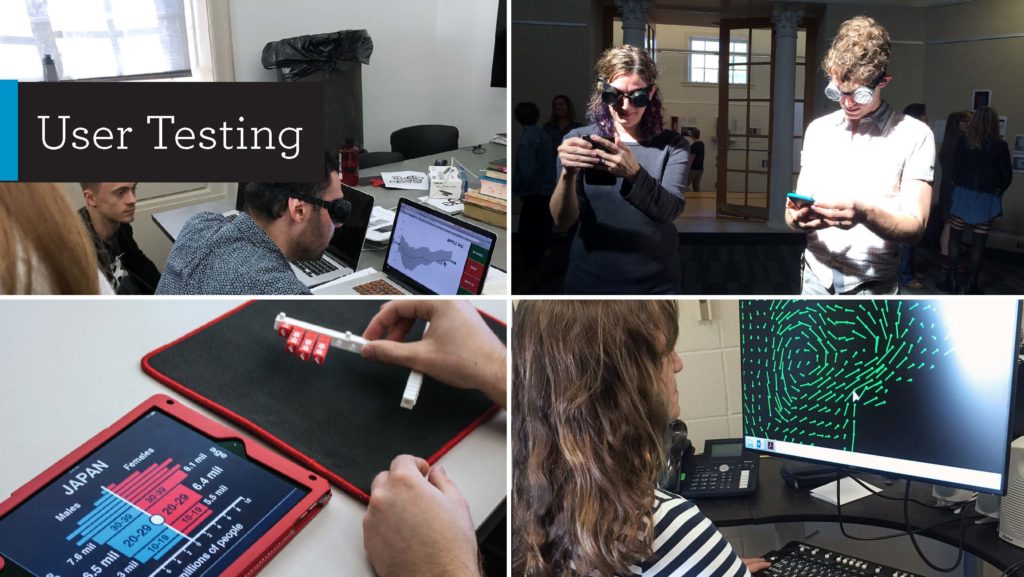
used digital interfaces to simulate low vision
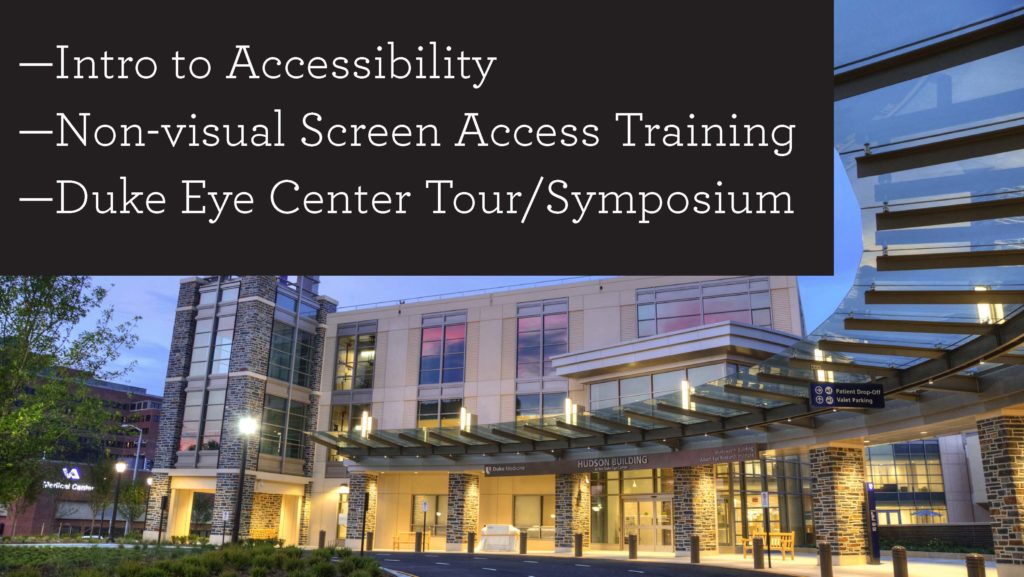
during the project student took part in an intro to accessibility training, non-visual screen access training and attended a symposium at Duke Eye Center detailing different kinds of visual impairment conditions
used digital interfaces to simulate low vision
Woman wearing googles that simulate a visual impairment
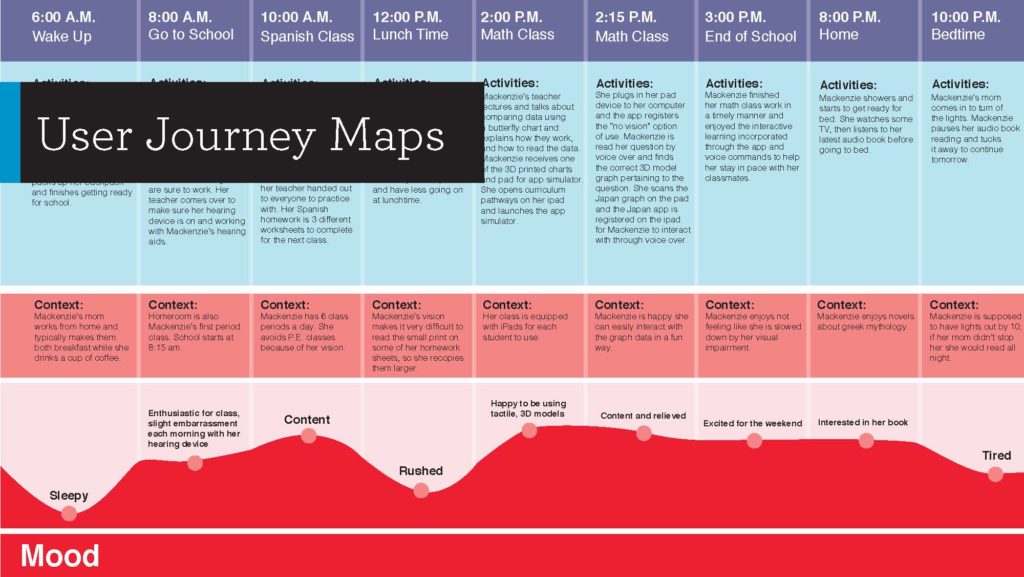
create user journey maps
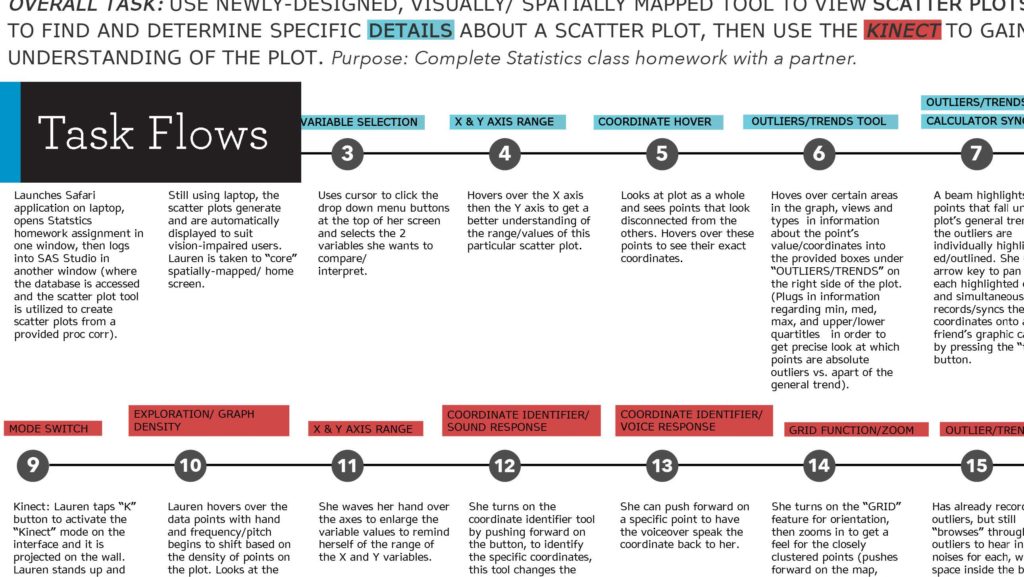
created task flows
created studies of possible forms the visualizations could take
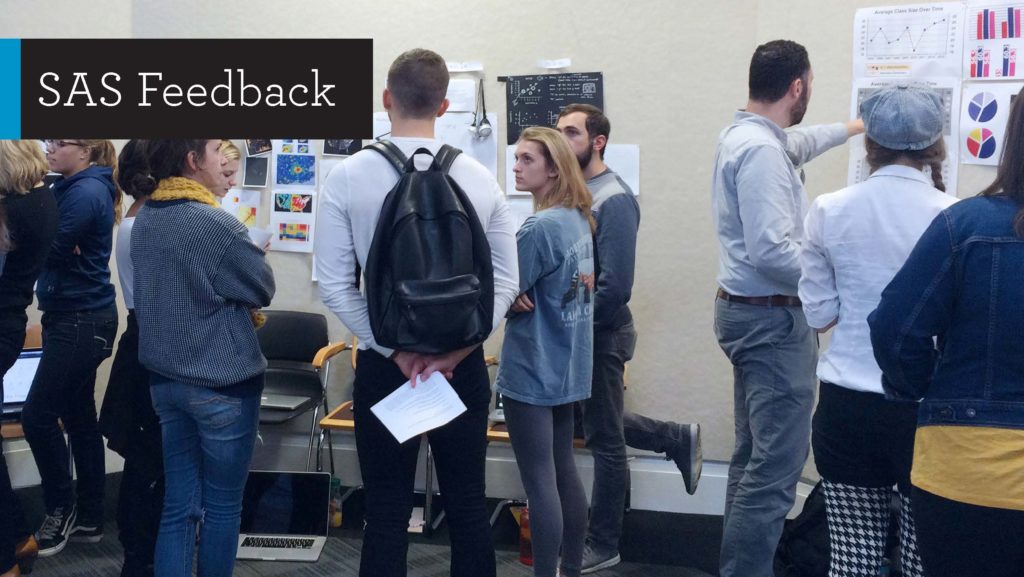
SAS team members came to the NC State to lead critiques
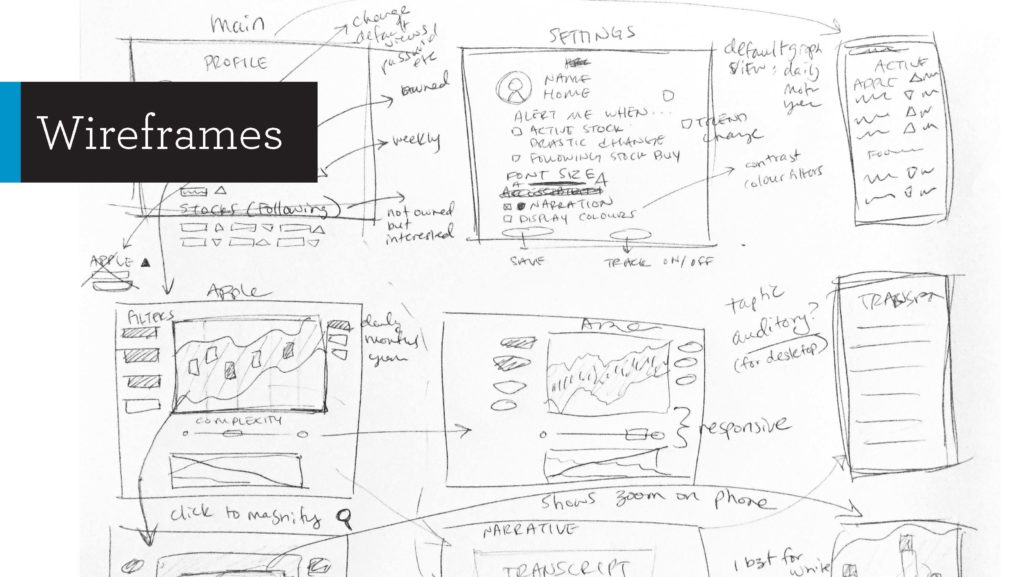
Create rough wireframes of interfaces
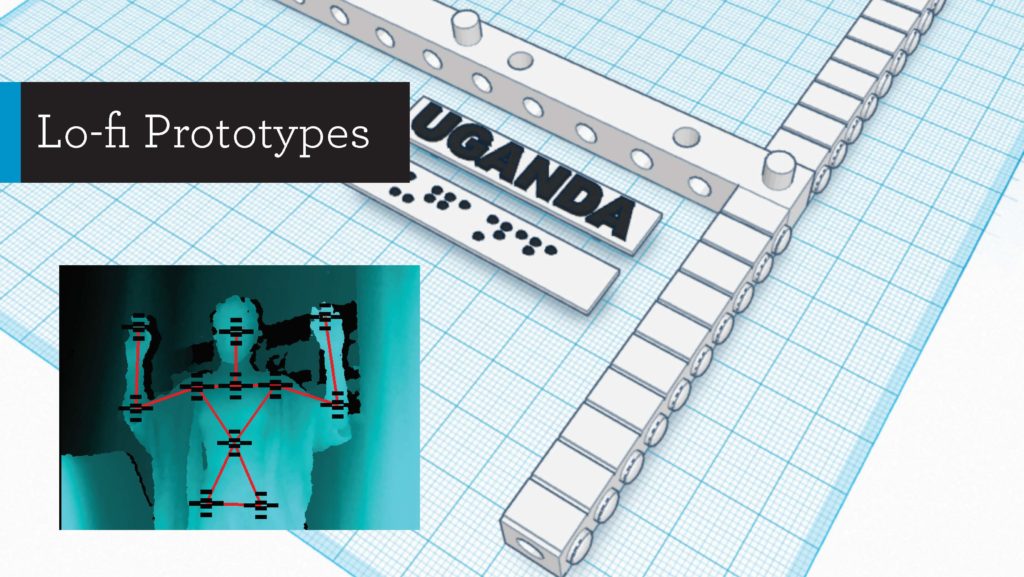
Created lo-fi prototypes of interfaces
user tested lo-fi prototypes with low vision users
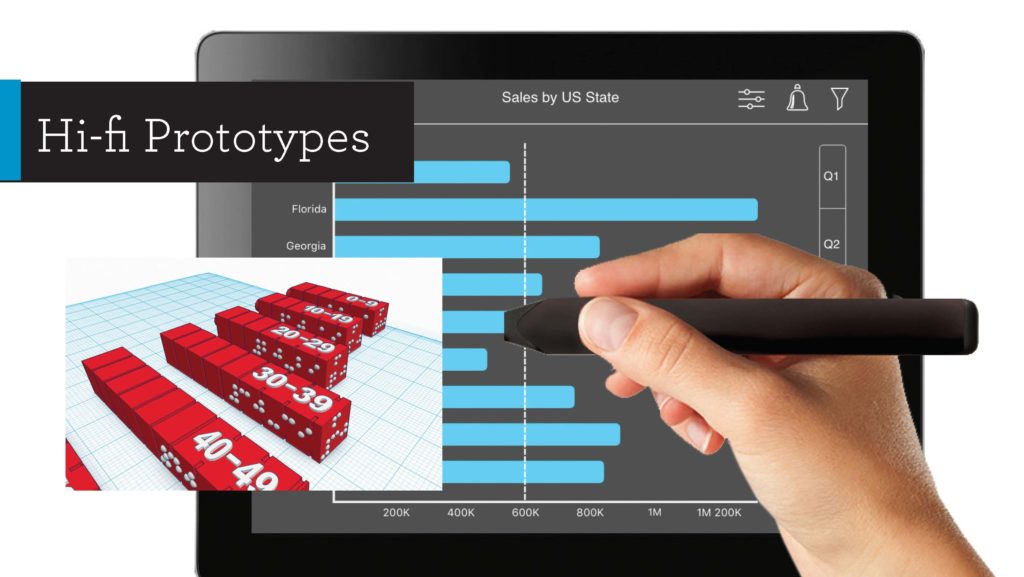
create hi-fi prototypes
create hi-fi interfaces with hi-contrast and magnified elements